
Case study · BESmart
Corporate education · multi-entity · multi-currency
We were profitable the whole time. We just couldn't prove it.
Screenshots use illustrative data — not real BESmart figures.
The company trained other companies — workshops, consulting, corporate education — running across a handful of legal entities and contractors, invoicing in whatever currency the client happened to pay in. On paper, business was good. Nobody could actually prove it.
Every month ended the same way: someone opening four or five spreadsheets, trying to make them agree with each other, and mostly failing.
“How much did we make this month?” depended entirely on who you asked.
That was the real starting point — not a feature request, not a tool complaint. Just one question nobody could answer with confidence.
So we didn't start by building a dashboard. We started by mapping how the business actually moved — every project, every payment, every client, every handoff between teams. Only once that map existed did the system get built on top of it: one place where a payment, a project, and a client were never disconnected from each other again.
One number, one answer
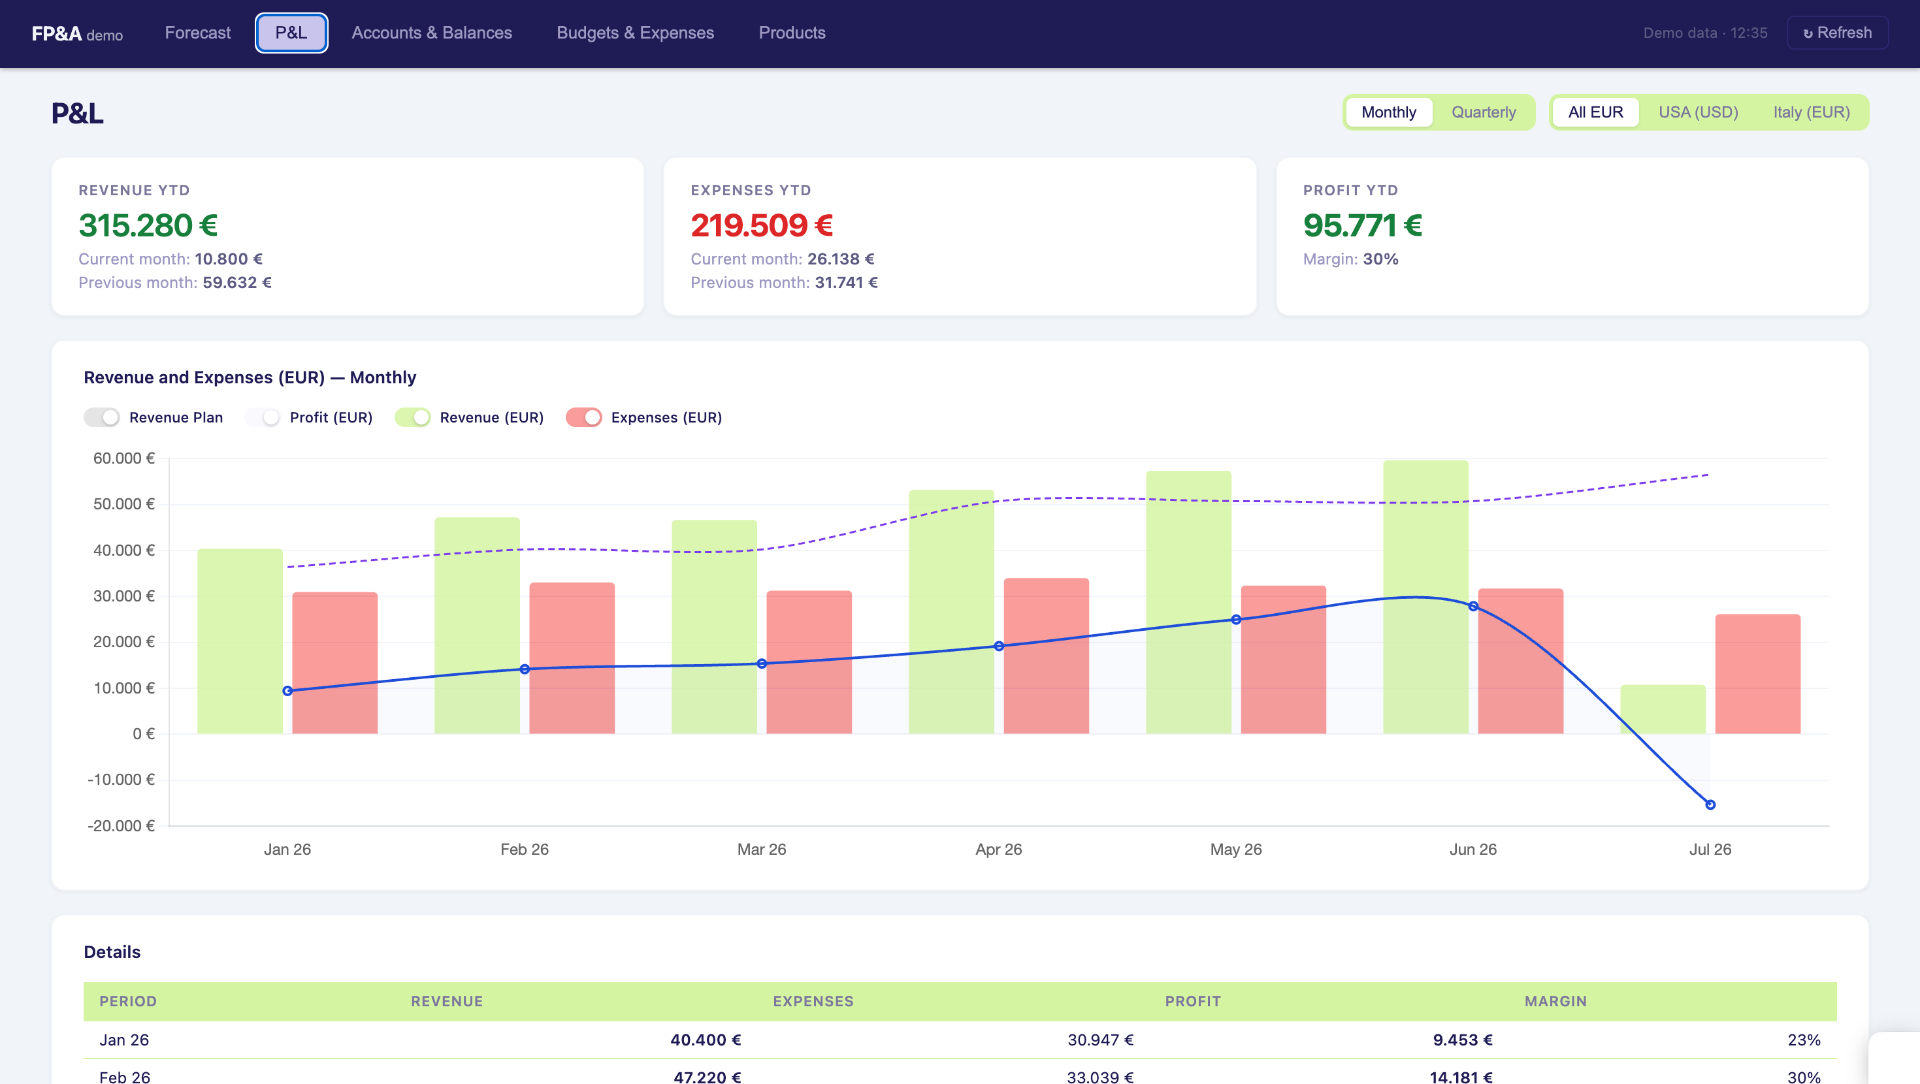
The first thing that changed was the most basic one. Revenue, expenses, gross profit — one live number, the same one no matter who opened it.
For the first time, "how much did we make" had one answer instead of five.
Profit per project, not per year
Then came the harder question — not how much the company made, but which parts of it actually made money. Before, project profitability was invisible until the year closed, sometimes not even then. Once every payment and expense linked back to a project, a client, a service — profit per project stopped being a year-end surprise and became something you could check on a Tuesday.
Cash, without the ritual
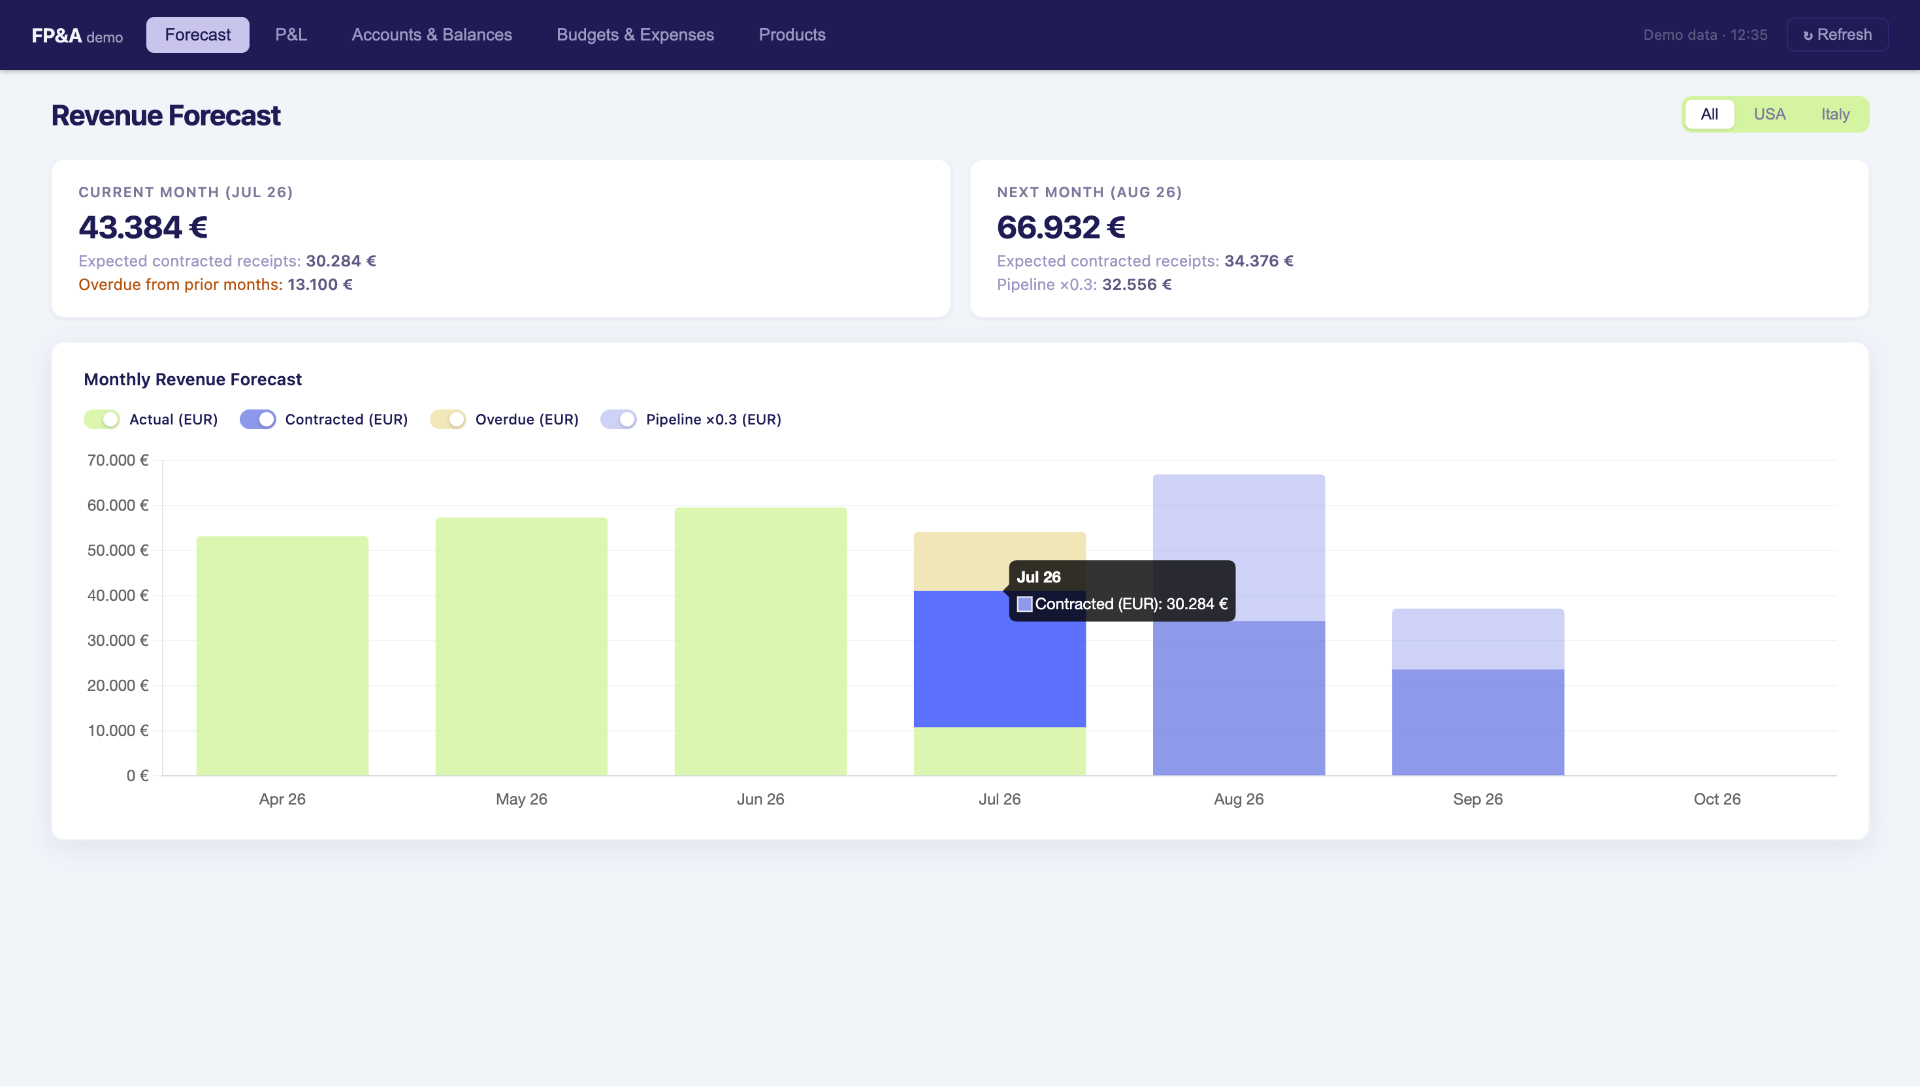
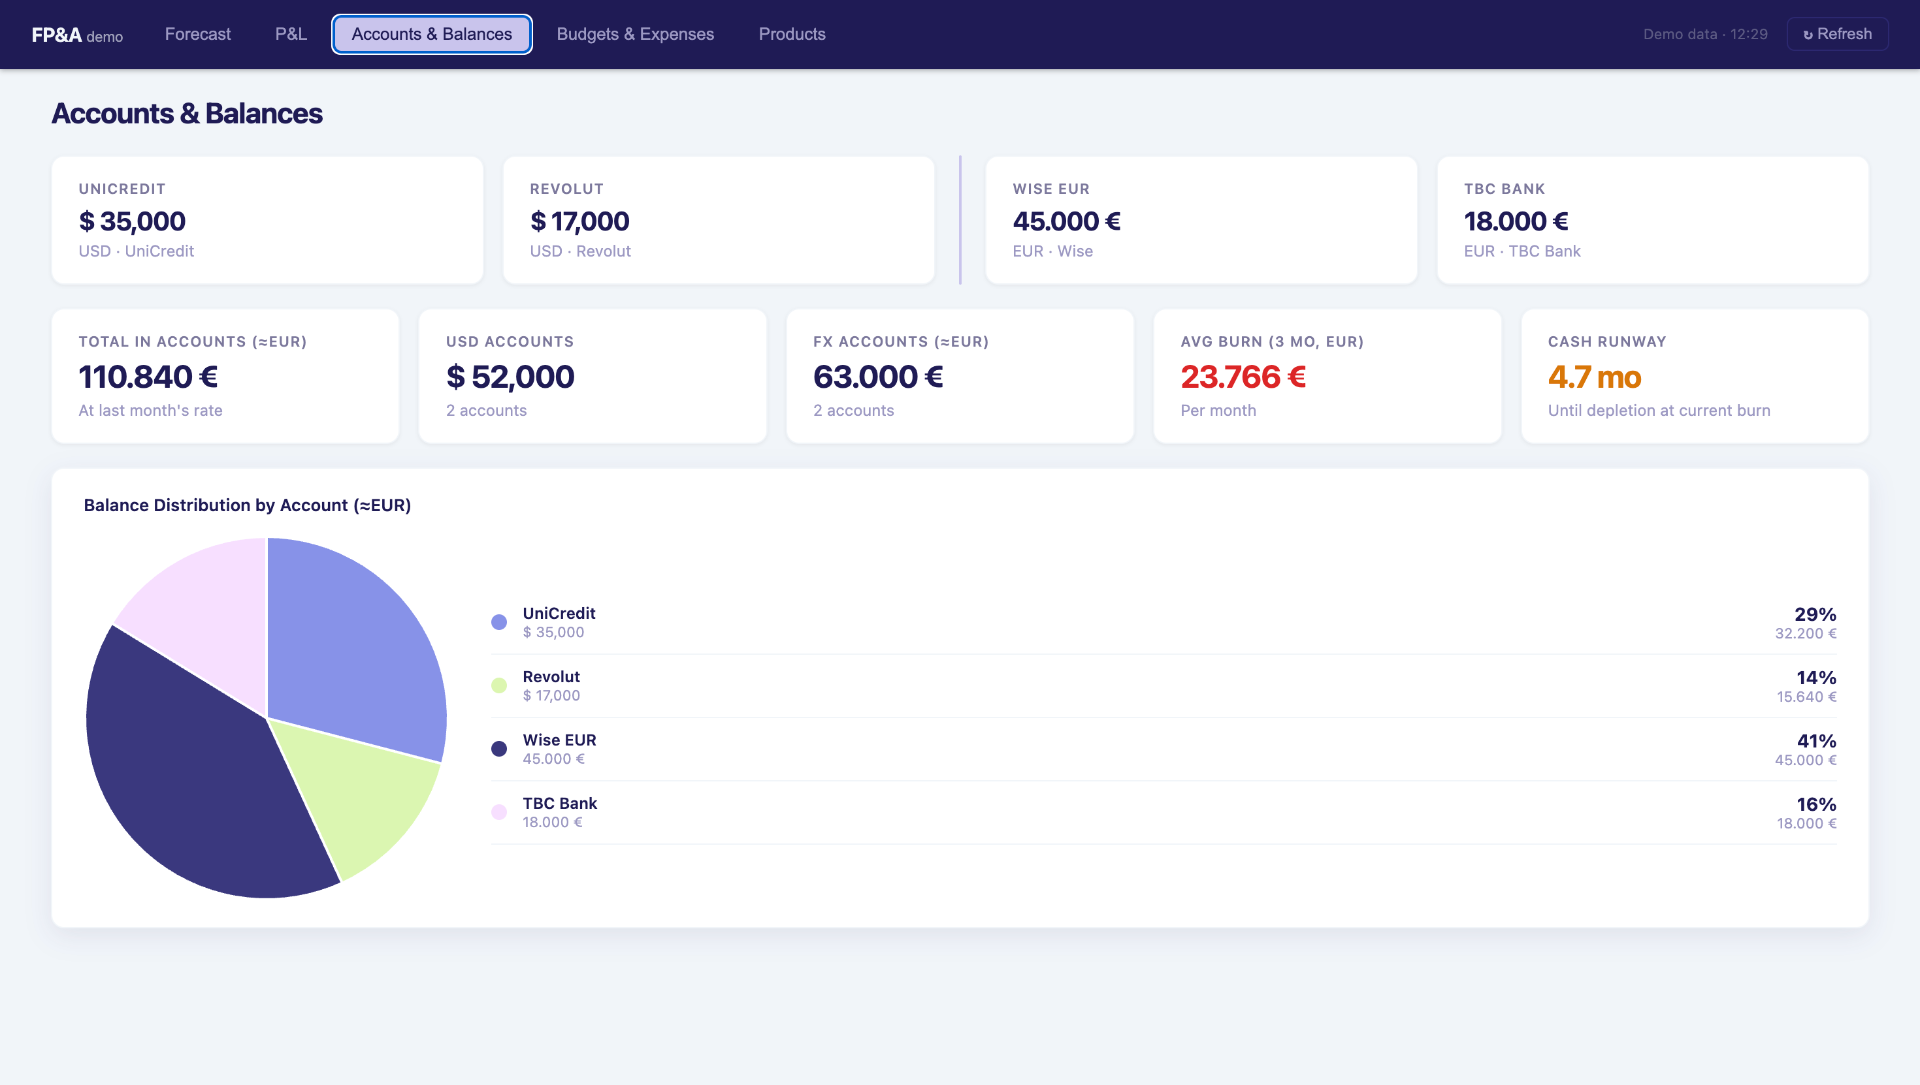
Cash told its own story. Checking the company's real cash position used to mean logging into several bank accounts, in several currencies, and doing the arithmetic by hand — a small ritual of guesswork. It became one number: consolidated position, burn rate, runway, always current.
Nobody had to ask "do we have enough runway" and wait for an answer anymore. It was just there.
Overspend, same week — not same quarter
Budgets used to surface their damage late — payroll or marketing overspend showing up in a quarterly review, well past the point of doing anything about it. Now it showed up the same week it happened, not the same quarter.
And the question every services business eventually has to face — which of our offerings is actually worth doing more of — stopped being a guess once sales and revenue per product sat in one view instead of scattered across memory and habit.
What was left
What was left at the end wasn't a tool. It was an answer — the same one, every time, for everyone in the company who needed it. Fewer lost invoices. No more chasing a colleague for a file. Decisions made in the time it used to take just to reconcile the numbers.
The hardest part was never the software. It was turning "how this business actually runs" into numbers that update themselves.
That's the part we kept — and built into Sumzee, so the next company doesn't need a bespoke project to get it.
“For a long time, we couldn’t objectively evaluate how effective our project work really was — we had a plan, but once a project wrapped, we had no clear picture of how realistic that plan had actually been. Rolling out Airtable gave the team a simple way to track time without adding extra workload — and for the first time, we saw how our work is actually structured, in terms of resources and economics. That’s already shaping our management decisions.”

Want the same answer for your company?
See how a financial dashboard could work for your business.
Get your prototypeAnswer 9 questions, then book a call.