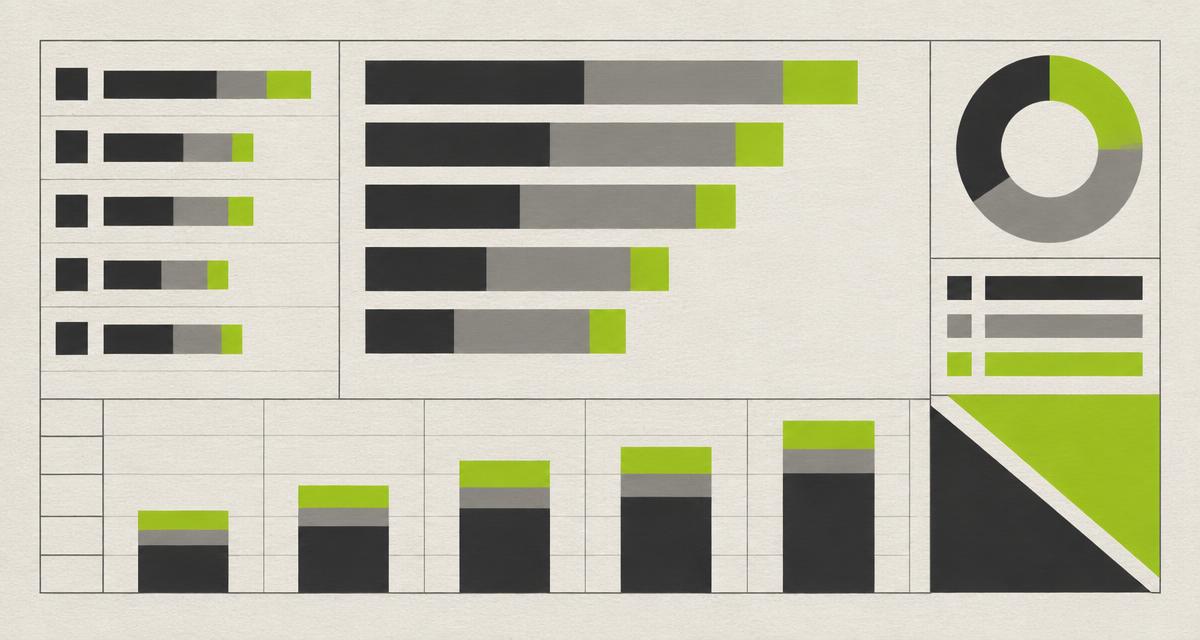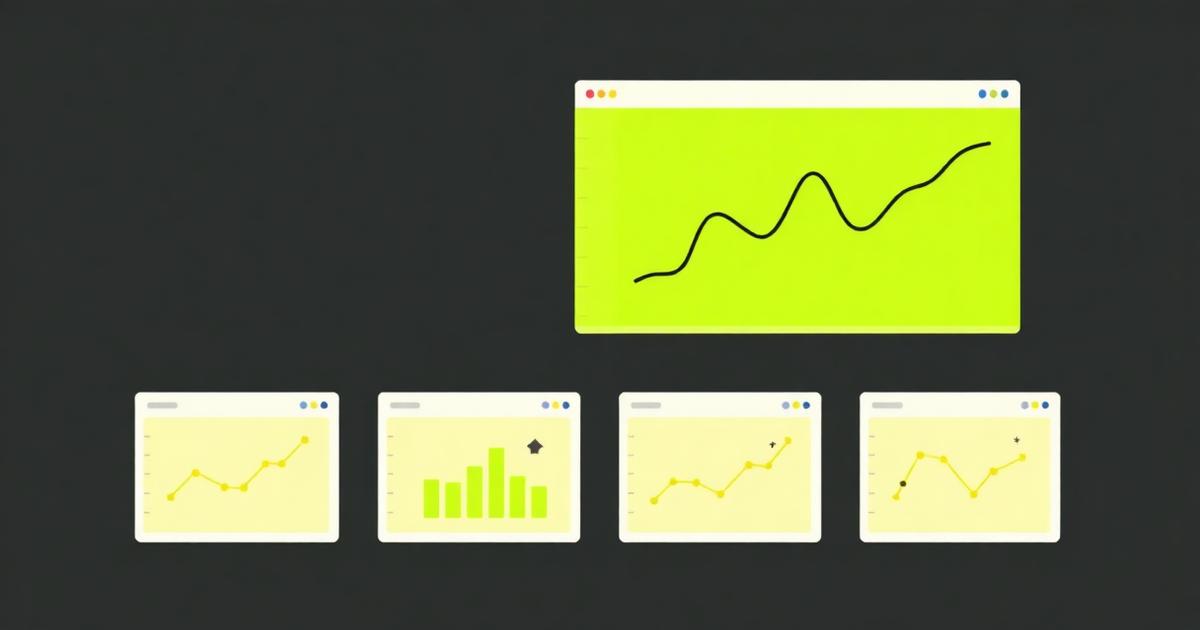
A dashboard is not a report. A report describes the past; a dashboard tells you whether to change something this week. If a chart has never once changed a decision, it is decoration.
1. Cash in the bank, today
The least sophisticated number is the one every founder checks first. Put it top left, updated daily, with last week beside it so the direction is visible without arithmetic.
2. Net burn and runway
Average net burn over three months, then divide cash by it. One month of data makes an annual insurance payment look like a collapse. Runway under six months should change hiring plans; over eighteen it buys the right to experiment.
3. Gross margin by line of business
Blended margin hides the product that loses money on every sale. Split it by service, plan or segment and the pricing conversation stops being an opinion.
4. Collections: what is owed and how late
Receivables bucketed by age turn a vague worry into a call list. Anything past 45 days is not late paperwork, it is a decision someone made.
5. The 13 to 26 week cash forecast
One line, weekly resolution, with the negative weeks marked. This is the only chart on the list that looks forward, and it is the one that prevents emergencies.
Everything else is a second click. If a metric does not sit under one of these five questions, it belongs in a detail view, not on the front page.