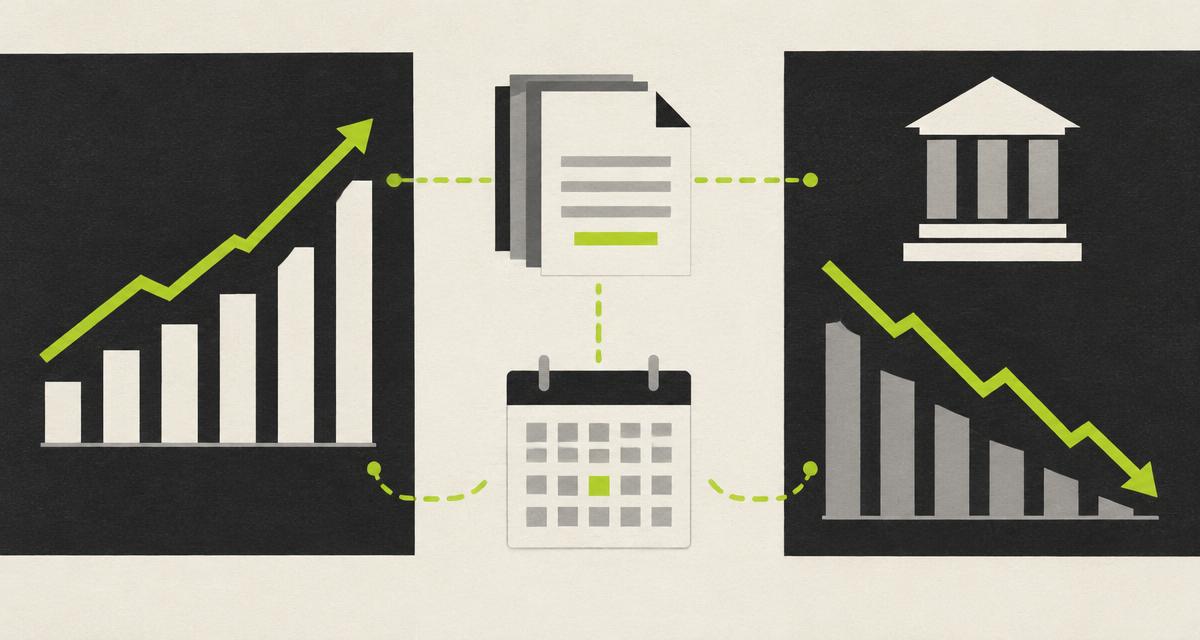
Agency founders rarely suffer from a complete lack of data. Revenue lives in accounting software. Project budgets sit in spreadsheets. Team hours are recorded in a time-tracking tool. Invoices are stored somewhere else. Bank balances have to be checked separately.
The problem is that these numbers do not automatically create a useful view of the business. A CEO does not need another report filled with financial terminology. They need a dashboard that answers practical questions:
- Are we actually profitable?
- Where is the profit coming from?
- Which clients are reducing our margins?
- Will we have enough cash for payroll and taxes?
- Can we afford to hire?
- Are costs growing faster than revenue?
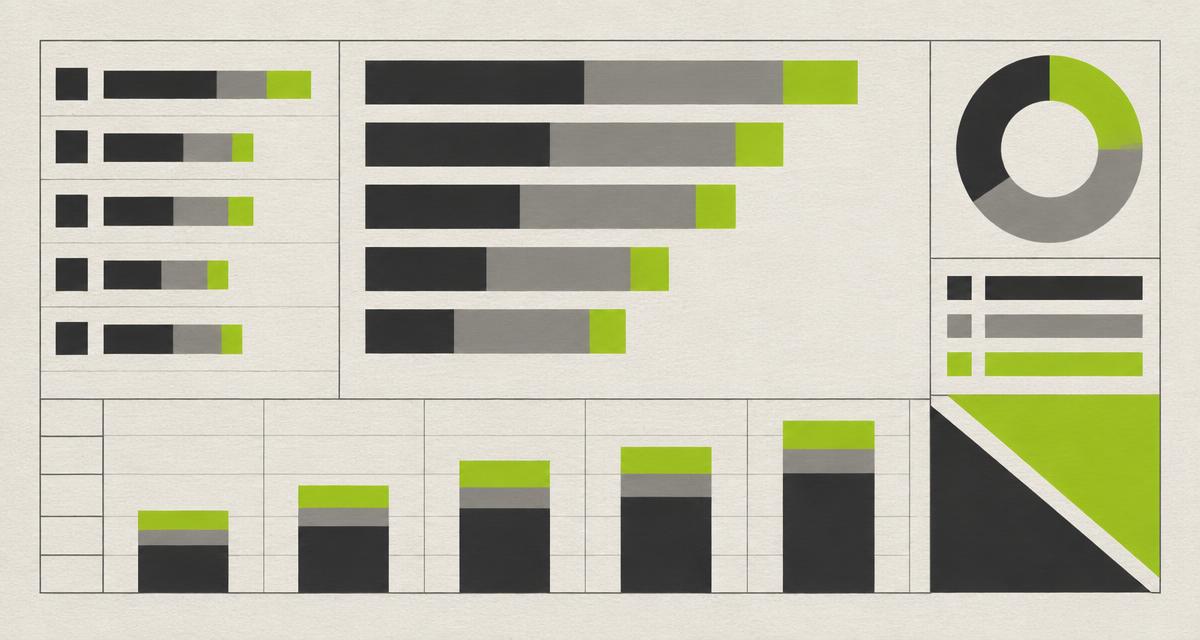
A useful agency CEO dashboard brings these answers together in one place. Here are the eight numbers worth reviewing every month.
See how Sumzee brings these numbers together in a financial dashboard for agencies.
The short answer
An agency CEO dashboard should show revenue, gross profit, gross margin, operating expenses, net profit, cash balance and forecast, accounts receivable, and profitability by client or project.
Together, these metrics show whether the agency is growing, whether that growth is profitable, where cash is tied up and which clients or projects are creating value.
1. Revenue
The question it answers: How much did the agency earn during the period?
Revenue is the natural starting point for a monthly review. It shows the total value of the work the agency recognised during the month. But the number becomes useful only when it has context.
- Compare it with the previous month and the same month last year.
- Compare it with the monthly target and the previous three-to-six-month average.
- Compare it with expected revenue for the coming months.
- Break it down by client, project, service, work type, entity and currency.
For example, total revenue may have increased by 15%, while revenue from the agency’s core service has declined. The growth may be coming from a single large project that will not repeat next month. The total number looks positive. The breakdown tells the CEO whether the growth is sustainable.
- Is revenue growing or falling?
- Is growth coming from recurring or one-off work?
- How dependent is the agency on its largest client?
- Is recognised revenue turning into collected cash?
- Does the current pipeline support future revenue?
Revenue measures activity and scale. It does not show how much of that revenue the agency keeps. That requires the next number.
2. Gross profit
The question it answers: How much money remains after delivering the client work?
Gross profit is revenue minus the direct cost of delivery. For an agency, direct costs may include client-facing employee salaries, freelancer and contractor fees, production costs, project-specific software, media or supplier costs, and other costs required to complete the work.
Revenue − direct delivery costs = gross profit. If an agency generates €100,000 in revenue and spends €55,000 delivering the work, its gross profit is €45,000. That amount must cover leadership, sales, marketing, administration and general software.
Gross profit is one of the clearest indicators of whether the agency’s delivery model is working.
- Are delivery costs growing faster than revenue?
- Are projects requiring more contractor support than expected?
- Is the team spending too much time on non-billable revisions?
- Have prices remained unchanged while salaries and supplier costs increased?
- Is one service generating much stronger gross profit than another?
A growing agency can still become financially weaker if every additional euro of revenue requires too much delivery cost.
3. Gross margin
The question it answers: How efficiently does the agency turn revenue into gross profit?
Gross profit is an amount. Gross margin is the same result expressed as a percentage of revenue: Gross profit ÷ revenue × 100 = gross margin. Using the previous example, €45,000 ÷ €100,000 × 100 = 45% gross margin.
This percentage makes it easier to compare months, services and projects of different sizes.
| Project | Revenue | Gross profit | Gross margin |
|---|---|---|---|
| Project A | €60,000 | €24,000 | 40% |
| Project B | €30,000 | €18,000 | 60% |
Project A produces more revenue and gross profit in absolute terms, while Project B uses its revenue more efficiently. This does not automatically make Project B better: capacity, duration, strategic value and payment terms still matter. But margin reveals something revenue alone cannot.
- Is gross margin improving or declining?
- Which services have the strongest margins?
- Are estimates reflecting the real cost of delivery?
- Is scope creep reducing the margin after work begins?
- Are discounts being approved without understanding their effect?
Gross margin is especially valuable as a trend. A small decline may not look urgent in one month, but a downward pattern can signal pricing or delivery problems before net profit disappears.
4. Operating expenses
The question it answers: What does it cost to run the agency beyond client delivery?
Operating expenses maintain the company but are not directly attributed to an individual project. They may include management and administrative salaries, sales and marketing, general software, office expenses, legal and accounting services, insurance, recruitment, professional development and other overhead.
The dashboard should show both the total and a category breakdown. Compare actual spending with budget, this month with previous months, operating expenses as a percentage of revenue, and recurring costs with one-off costs.
A total expense number does not explain what changed. Operating expenses may rise because of a planned sales investment or through dozens of unchecked software subscriptions. The financial effect may be similar, but the management response should be different.
- Which expense categories changed most?
- Was the increase planned?
- Are recurring subscriptions still being used?
- Has the agency added fixed costs ahead of confirmed revenue?
- Is the current overhead sustainable during a slower quarter?
The goal is not to minimise every cost. It is to understand which costs support growth and which reduce profit without creating sufficient value.
5. Net profit
The question it answers: After all recognised expenses, did the agency actually make money?
Net profit remains after delivery costs and operating expenses are deducted from revenue: Revenue − delivery costs − operating expenses = net profit.
- Net profit and net profit margin for the month.
- Comparison with the previous period.
- Year-to-date profit.
- Actual profit versus target.
If revenue increases but net profit falls, the agency is growing without keeping enough of the additional revenue. Possible causes include weaker project margins, growing payroll, excessive contractor use, discounts, rising overhead, unplanned scope or a change in the mix of services.
- Is revenue growth producing profit growth?
- What percentage of revenue becomes net profit?
- Is the result consistent or dependent on one unusually strong month?
- Which cost changes explain the difference?
- Are owner compensation and other relevant costs treated consistently?
Net profit should never be reviewed without revenue and gross margin. Profit also should not be confused with available cash: an agency can report a healthy profit while waiting for clients to pay.
6. Cash balance and forecast
The question it answers: Do we have enough cash for the payments ahead?
The current bank balance shows what the agency has today. A cash forecast shows what may happen next. A useful dashboard displays cash available now, expected client payments, expected operating payments, upcoming payroll, contractor commitments, tax obligations, projected weekly cash and the lowest expected balance.
A rolling 13-week forecast is often practical for an agency. It is short enough to update regularly and long enough to reveal an approaching shortage. For example, €70,000 today may fall below €10,000 in eight weeks because of delayed payments, a tax deadline and a planned hire. Without a forecast, the current balance can create false confidence.
- What is the lowest projected cash balance and when could a gap occur?
- Which client payments does the forecast depend on?
- What happens if the largest payment arrives 30 days late?
- How will a new hire affect cash over the next three months?
- How much of the current balance is reserved for tax?
For more detail on this distinction, read Agency Profit vs Cash Flow: Why a Profitable Agency Can Still Run Out of Cash.
7. Accounts receivable
The question it answers: How much earned revenue is still waiting to become cash?
Accounts receivable is the money clients owe the agency for work already invoiced. The dashboard should show total unpaid invoices, invoices due soon, overdue invoices, invoices more than 30, 60 or 90 days overdue, clients responsible for the largest balances and average collection time.
An agency may appear profitable while a growing amount remains unpaid. This becomes particularly risky when one client represents a large share of expected cash. The dashboard can also track days sales outstanding, or DSO, to show how long collection typically takes.
- Is accounts receivable increasing faster than revenue?
- Which invoices are overdue?
- Are particular clients consistently paying late?
- Is the agency invoicing promptly after delivery?
- Are billing errors delaying payment?
- Is too much expected cash concentrated in one client?
Improving collections does not increase revenue, but it can substantially improve financial stability.
8. Profitability by client or project
The question it answers: Which work actually earns its keep?
Total company profit can hide weak projects. One client may produce significant revenue but require more team hours, repeated revisions, extensive project management, unplanned senior involvement, extra contractor support and work outside scope. A smaller client may be easier to deliver, pay faster and produce a stronger margin.
A project-profitability view should compare recognised revenue, planned and actual delivery costs, gross profit, gross margin and budget versus actual result. Where possible, monitor how margin changes during the project rather than waiting until completion.
- Which clients and projects produce the strongest margins?
- Which ones are below target?
- Where did actual delivery costs exceed the estimate?
- Is scope creep being recorded and priced?
- Which services are most financially attractive?
- Should a contract be repriced, redesigned or discontinued?
This number turns the dashboard from a reporting tool into a decision-making tool. It can influence pricing, project scope, staffing, client selection and the services the agency chooses to grow.
What an agency CEO dashboard might look like
Imagine a 12-person agency reviewing its August results:
| Metric | August result | Change | What it suggests |
|---|---|---|---|
| Revenue | €125,000 | +12% | Growth is strong |
| Gross profit | €58,750 | +5% | Profit grew slower than revenue |
| Gross margin | 47% | −3 pp | Delivery became less efficient |
| Operating expenses | €42,000 | +8% | Overhead is increasing |
| Net profit | €16,750 | −2% | Revenue growth did not improve profit |
| Lowest forecast cash balance | €9,500 | — | Possible cash pressure in six weeks |
| Accounts receivable | €71,000 | +24% | More revenue remains uncollected |
| Lowest client margin | 18% | −9 pp | One client requires attention |
A revenue-only report would call August successful. The complete dashboard shows that delivery costs grew faster, net profit declined, unpaid invoices increased, cash pressure may be approaching and one client’s margin deteriorated significantly.
- Review the low-margin client and identify unplanned work.
- Follow up on the largest unpaid invoices.
- Update the six-week cash forecast.
- Reconsider new fixed costs until collections improve.
- Review whether recent projects were underpriced.
This is what a CEO dashboard should do: turn numbers into decisions.
How to run the monthly financial review
A dashboard is useful only if it supports a consistent review process. A practical monthly meeting can follow five steps.
1. Check data completeness
Confirm that revenue, costs, invoices and payments have been added and categorised correctly. Missing contractor costs or uncategorised payments can make the result misleading.
2. Compare actual results with the plan
Review both the amount and the variance. A difference is not automatically a problem. The important question is why it happened and whether it will repeat.
3. Identify the three biggest changes
Avoid discussing every line equally. Focus on the changes that had the greatest effect on profit, cash or project margins.
4. Look forward
Review upcoming invoices, payroll, tax payments, contractor commitments and planned hires. A financial review should not stop with the month that has already ended.
5. Assign decisions and actions
Every significant issue should lead to an owner and a next step: follow up on an overdue invoice, re-estimate a project, cancel unused software, change a billing schedule or delay a hire until a specific payment is collected. The dashboard should make the conversation shorter and more focused, not create another reporting task.
What not to put on the dashboard
More metrics do not automatically create more clarity. Avoid filling the main CEO view with numbers that do not lead to a decision, are not updated consistently, have no agreed definition, duplicate another metric, are relevant only to one department or require a long explanation every month.
Detailed operational data can remain available in supporting views. The CEO dashboard should stay focused on the financial questions that determine whether the agency can operate, invest and grow.
One dashboard should connect the numbers
The eight metrics are most useful when they come from the same underlying data. If revenue is calculated in one spreadsheet, project costs in another and cash in a separate report, the team may spend more time reconciling numbers than discussing decisions.
A connected financial view lets the CEO move from net profit to gross margin, from margin to a specific project, from projected cash to an unpaid invoice, from rising expenses to the relevant category, and from revenue growth to the clients and services driving it. This is the difference between receiving a report and having financial control.
Build the financial view your agency needs
Sumzee brings revenue, costs, invoices, payments and project margins into one connected financial dashboard. The setup is built around the way your agency already works, including the tools, exports, entities, currencies and reporting rules you use today.
See how Sumzee brought revenue, profit and cash into one view across projects, legal entities and currencies in the BESmart case study.
If your agency still rebuilds its financial report every month, book a call with Sumzee to discuss the dashboard your business needs.
This article provides general educational information. The most appropriate metrics and accounting treatment depend on your business model, location and reporting requirements.